
Related Products
What Is Stock Turnover? How to Calculate, Interpret, and Improve It
Learn what stock turnover means, how to calculate the stock turnover ratio, interpret results, and improve inventory efficiency.

Learn what stock turnover means, how to calculate the stock turnover ratio, interpret results, and improve inventory...
Two companies may generate similar sales volumes while tying up very different amounts of capital in inventory. One may sell and replenish its stock quickly, while the other allows large quantities of goods to remain in storage for extended periods.
Stock turnover helps explain this difference. It measures how quickly inventory is converted into sales or consumed in production, allowing businesses to assess whether purchasing volumes, inventory structure, and actual demand are properly aligned.
For retailers, manufacturers, distributors, and third-party logistics providers, stock turnover is not only a financial metric. It can also reveal operational problems such as slow-moving inventory, unbalanced replenishment, and excessive working capital tied up in stock.
What Is Stock Turnover?
Stock turnover, also known as the stock turnover ratio, inventory turnover, or inventory turnover ratio, indicates how many times a company’s average inventory is sold or consumed during a specific period.
Suppose a company has an annual stock turnover ratio of 6. Based on the average value of its inventory, this means the company turns over its inventory approximately six times per year.
One inventory turnover does not mean that every item in the warehouse is sold on the same day and then completely replenished. Instead, it is an overall metric that compares the cost of goods sold during a given period with the average value of inventory held by the business.
Stock turnover can help a company understand:
- Whether current inventory is aligned with actual sales or production demand
- How quickly capital invested in inventory is converted into sales
- Whether the business holds inventory that has remained unsold or unused for too long
- Whether purchasing and production batch sizes are appropriate
- Whether the overall inventory mix is healthy
However, stock turnover alone cannot provide a complete picture of inventory performance. It should be interpreted alongside product characteristics, supply lead times, seasonal demand, and customer service requirements.
How Is STR Calculated?
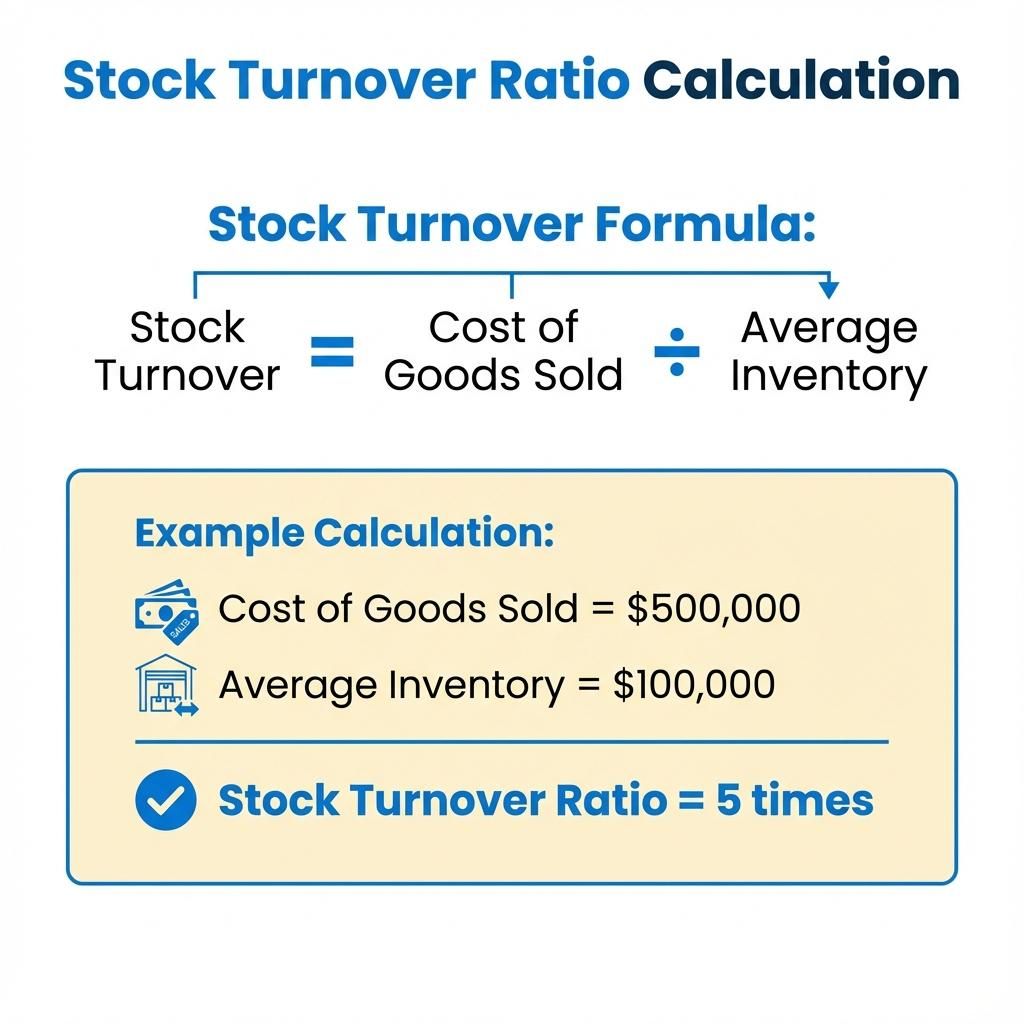
STR commonly stands for stock turnover ratio. The most widely used formula is:
Stock Turnover Ratio = Cost of Goods Sold ÷ Average Inventory Value
Where:
- Cost of goods sold (COGS) is the cost associated with the goods sold or inventory consumed during the measurement period.
- Average inventory value is the average monetary value of the inventory held during the same period.
When inventory levels remain relatively stable, average inventory can be calculated using the opening and closing inventory values:
Average Inventory = (Opening Inventory + Closing Inventory) ÷ 2
For example, suppose a business reports the following annual figures:
- Annual cost of goods sold: $1,200,000
- Opening inventory: $180,000
- Closing inventory: $220,000
First, calculate the average inventory:
Average Inventory = ($180,000 + $220,000) ÷ 2 = $200,000
Then calculate the stock turnover ratio:
Stock Turnover Ratio = $1,200,000 ÷ $200,000 = 6
This means the company’s average inventory turned over approximately six times during the year.
The ratio can also be converted into the more intuitive average number of days inventory is held:
Days Inventory Outstanding = 365 ÷ Stock Turnover Ratio
In this example:
Days Inventory Outstanding = 365 ÷ 6 ≈ 61 days
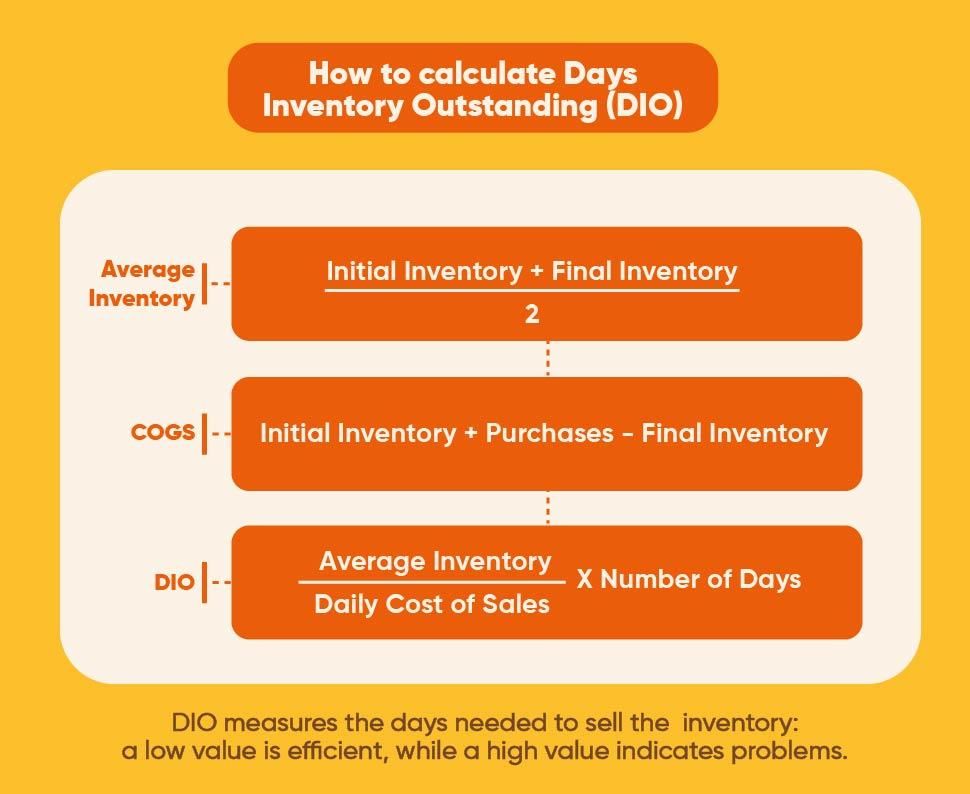
This means that inventory takes an average of approximately 61 days to be sold or consumed after entering the business.
If a company has strong seasonal demand or inventory levels fluctuate significantly throughout the year, relying only on opening and closing inventory may produce a distorted result. In this case, monthly inventory balances can be used:
Average Inventory = Total Monthly Inventory Balances ÷ Number of Months
When sufficient data is available, weekly or daily inventory balances can provide an even more accurate average.
How to Interpret High or Low Stock Turnover
There is no single stock turnover benchmark that applies to every business. Appropriate turnover rates for fast-moving consumer goods, food, and apparel are usually very different from those for industrial equipment, maintenance spare parts, and customized products.
Stock turnover is therefore most useful when compared with the company’s historical performance, internal targets, and businesses with similar products and operating models.
High Stock Turnover
A high stock turnover ratio generally means that inventory is being converted into sales or production consumption relatively quickly. The company may be holding less average inventory while using warehouse space and working capital more efficiently.
For products with short shelf lives, rapidly changing demand, or frequent model updates, higher turnover can also reduce the risk of expiration and obsolescence.
However, an unusually high turnover ratio may indicate that the company is holding insufficient inventory. This can lead to frequent stockouts, emergency replenishment, delayed deliveries, and lost sales when products are unavailable.
Whether a high turnover rate is healthy should therefore be assessed alongside order fulfillment rates, stockout frequency, and expedited purchasing costs.
Low Stock Turnover
A low stock turnover ratio means that products or materials remain in storage for longer periods.
This may be caused by declining demand, oversized purchasing batches, an overly complex product range, or increasing quantities of slow-moving inventory. Low turnover can raise storage, insurance, stocktaking, and financing costs while increasing the risk of expiration, damage, or loss of market value.
However, low turnover does not always indicate poor inventory management. Critical maintenance parts, seasonal inventory, long-production-cycle equipment, and raw materials with lengthy supply lead times may reasonably remain in stock for extended periods to protect operational continuity.
The objective is not simply to achieve the highest possible turnover ratio. The appropriate level is one that balances inventory efficiency with the company’s delivery targets and operating model.
Common Pitfalls and Limitations
The stock turnover ratio is relatively easy to calculate, but inconsistent data or inappropriate comparisons can produce misleading conclusions.
Using Sales Revenue Instead of Cost of Goods Sold
Inventory is normally valued at cost, so cost of goods sold should generally be used as the numerator in the formula.
Sales revenue includes profit. If revenue is divided by average inventory, changes in selling prices, discounts, or gross margins can alter the ratio even when the actual speed of inventory movement has not changed.
Using Only Opening and Closing Inventory
Opening and closing inventory represent only two points in time and may not reflect the average inventory held throughout the period.
For example, if a company clears a large amount of inventory shortly before the end of the year, its closing inventory may be significantly lower than its typical level. Using only the opening and closing values would underestimate average inventory and make turnover appear higher than it actually was.
Comparing Unrelated Industries
Purchasing cycles, product values, shelf lives, and sales models vary considerably between industries.
A food retailer may turn over inventory within a few weeks, while an industrial equipment supplier may hold stock for several months or longer. Direct comparisons between unrelated industries therefore provide little practical value.
Allowing Overall Results to Hide SKU-Level Problems
A reasonable company-wide turnover ratio does not mean that every product is performing well.
A small number of fast-selling products may raise the overall ratio while the warehouse still contains substantial quantities of slow-moving or obsolete SKUs. Inventory should therefore also be analyzed by product category, warehouse, region, or individual SKU.
Relying on Short-Term Data During Seasonal Fluctuations
Inventory levels for holiday products, clothing, agricultural goods, and promotional items may fluctuate considerably throughout the year.
Rapid sales during peak season may temporarily increase turnover, while advance purchasing may reduce it in the short term. Analysis should cover a complete business cycle rather than focusing on a single month.
Ignoring Inventory Write-Downs and Obsolescence
Some inventory may remain recorded on the balance sheet even though it is difficult to sell, can no longer be used, or should be scrapped.
If a company does not recognize inventory impairment promptly, its average inventory value may be overstated. This lowers the reported turnover ratio and may also conceal problems with inventory quality.
Strategies to Improve Stock Turnover
Improving stock turnover does not simply mean cutting inventory. A more effective approach is to align inventory quantities, product mix, and replenishment timing more closely with actual demand.
Improve Demand Visibility
Businesses should incorporate historical sales, customer orders, production plans, promotional activities, and seasonal changes into their demand forecasts.
Relying only on the previous year’s average sales may fail to capture current market changes. For products with volatile demand, forecasting cycles should be shortened and plans updated continuously using the latest order and sales data.
Purchasing, sales, production, and warehouse teams should also work from the same demand information. Otherwise, the sales plan may change while the purchasing department continues ordering according to an outdated forecast.
Apply Different Inventory Policies by SKU
Different SKUs should not automatically use the same safety stock levels, replenishment cycles, or order quantities.
Products can be classified according to sales velocity, inventory value, profit contribution, and operational importance. Fast-moving products should be managed to maintain availability, stable-demand products can use standardized replenishment rules, and slow-moving or unpredictable items should be purchased more cautiously.
Businesses should also review whether low-volume, low-margin, or highly similar SKUs should remain in the product range.
Reset Replenishment Parameters
An excessively high reorder point causes stock to arrive too early, while oversized order quantities create large inventory peaks after each delivery.
Companies should regularly recalculate:
- Reorder points
- Safety stock
- Maximum stock levels
- Economic order quantities
- Replenishment frequency
These parameters should be updated whenever customer demand, supplier performance, or transportation lead times change rather than remaining fixed indefinitely.
Identify and Remove Unproductive Inventory
Inventory with no recent sales, outbound movements, or production use should be identified separately from normal active stock.
Possible actions include discounting, product bundling, transferring stock to regions with stronger demand, returning goods to suppliers, or using the materials in other production projects. Inventory that no longer has commercial or operational value should be written down or disposed of promptly.
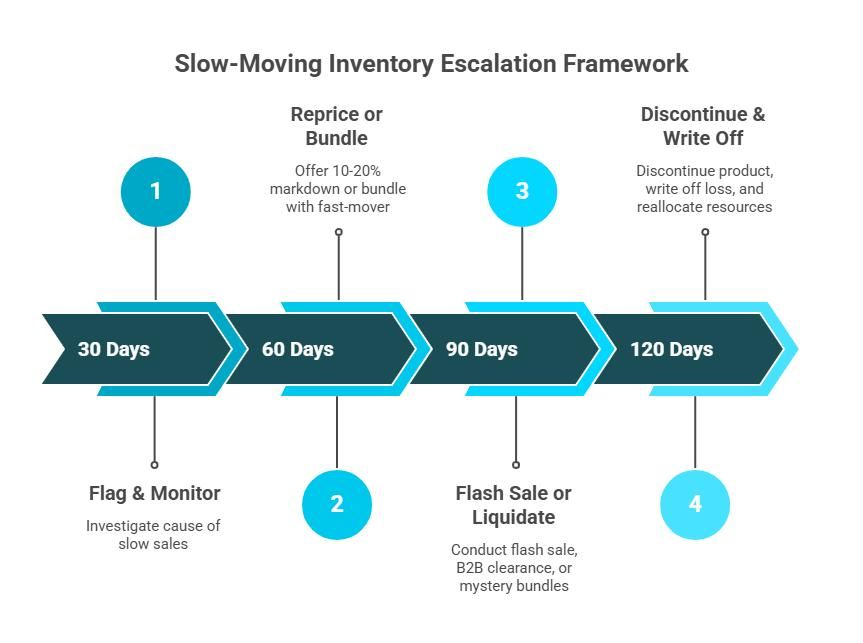
Stopping further purchases of slow-moving products is often more important than clearing the existing stock. Otherwise, the company may continue replenishing the same products while attempting to reduce them through promotions.
Shorten and Stabilize Supply Cycles
The longer and more variable the supply lead time, the more buffer inventory a business generally needs to hold.
Companies can reduce replenishment uncertainty by improving supplier coordination, increasing delivery frequency, sourcing from closer suppliers, or optimizing transportation methods.
Where ordering and transportation costs allow, smaller and more frequent replenishment orders can also reduce average inventory.
Improve Inventory Record Accuracy
Inaccurate inventory data directly undermines replenishment decisions.
If the system shows more inventory than is physically available, the company may experience unexpected stockouts. If recorded inventory is lower than the actual quantity, the company may purchase the same items again and create excess stock.
Barcodes, RFID, warehouse management systems, and regular cycle counting can help keep inventory quantities, locations, and conditions up to date. The more accurate the inventory data, the easier it becomes to reduce unnecessary safety stock and duplicate replenishment.

Improvements in stock turnover should be evaluated together with order fulfillment rates, stockout frequency, days inventory outstanding, and gross margin.
Effective inventory management is not about driving inventory as low as possible. It is about using a smaller but more accurate inventory base to support sales, production, and customer delivery.
Next Review
Move from article research to a scoped feasibility review.
Use the related products and solution paths below, then send your workflow and layout for a quick engineering review.
Related Solutions
Engineering Review